REDWOOD LOGIN
Redwood PortalLTL
SCS
SCS Support
Rockfarm

It’s cold in the Midwest, it’s snowing out the West Coast, it’s snowing on the East Coast. Tender rejections are up in Green Bay, tender rejections are up in Erie, PA. Tender rejections on the streets of Chicago, tender rejections in Kansas City, Cleeve-land O-hi-o. If you don’t get the reference, it’s okay. Sublime was a great band, but they only had a few albums.
We’re coming back to everyone fresh off the Martin Luther King Jr. holiday, which saw the typical drop-off in freight volumes, which was no doubt exacerbated by brutally inclement weather.
The same winter weather that wreaked havoc across the country led to dramatically increased tender rejections in the market as well. However, that’s not because the market has flipped. We believe the short-term increases we’re seeing in the Outbound Tender Reject Index (OTRI) and spot rates are caused by capacity issues, compounded by weather.
However, there are some underlying long-term trends that can’t be ignored, including the continued exit of carrier authorities — and the fact that election years generally don’t bode well for freight markets. We need to be aware that significant capacity removal is likely to have serious implications down the road.
Another trend to watch? Inventory levels. We’ll dive deeper into that topic next week, including a look at the global events and trends that might affect restocking patterns.
In the meantime, read on to learn more about what’s happening in the US logistics market this week, including a close look at market-specific dynamics.
Watch This Week's Redwood Rundown
Looking for an expert perspective on the US logistics industry? Join Christopher Thornycroft, Redwood’s EVP of Procurement, for the weekly Redwood Rundown. In just a few minutes, you can learn more about the news, events and trends that are sure to impact your business:
A Tight Market That’s Driven by Capacity, Not Demand
The first of our Top 3 Charts for the Week (see below) is a look at week-over-week tender rejections. Just a quick glance at the chart shows a lot of green, which means that tender rejections increased this week in just about every US market. What exactly do these numbers mean? For a refresher, we maintain that a tender rejection rate of 10% indicates that a spot market has been created. So far, we see 15 markets that have tipped into spot markets — however, none of the markets represent a top 15 volume market.
This doesn’t mean we’re saying that the market has flipped. Far from it. We’re set to enter February, and we know that month well. Post Lunar New Year, depressed freight volumes will almost certainly be the story, unless more weather-related or other critical events take place.
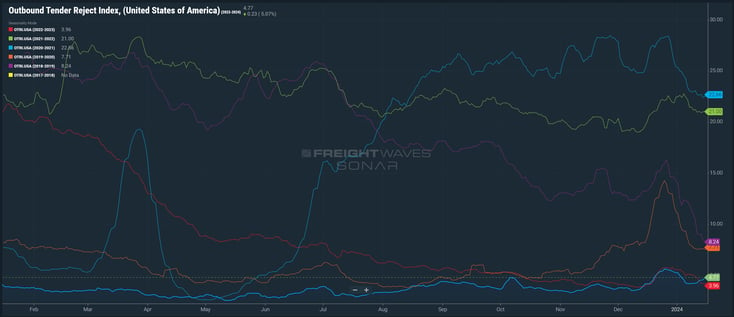
But the current environment is far more challenging than the lack of headlines would have one believe. The current OTRI is sitting at 4.77%, right where it sat on January 2. It’s climbed for five consecutive business days, going back to January 10 — which was long before the country took an ice bath. The Sonar OTRI only goes back to March 2018, but in that timespan, we have only seen January’s OTRI rise after the 10th in one year, 2022, which set the record for the highest spot linehaul ever ($2.70 a mile). When looking at the OTRI, it’s also worth noting that the short haul (100-250 miles) rejections, largely asset hauled, are 3.32%. But the mid haul (251-400 miles), tweener (451-800) and long haul (801+ miles) rejections are all over 5.7%. We have seen our own internal spot quote volumes rise along with these trends as well.
We should note that most of this pressure stems from immediate capacity issues, and not from demand growth. By any index, freight volumes have weakened back to 2023 levels after a fairly strong start to 2024. This is Q1 and Lunar New Year — happening on February 10, but February 9 for the work-week calendar — is approaching, which will signal the immediate slowdown of import volumes. So we believe the current market signals are more of a warning shot to future market sensitivity.
It is 100% true that freight markets do not turn over without demand increases, but waterfalls do weaken when capacity exits — and this does cause pain for shippers and brokers alike (June/December 2019 anyone?). It’s also worth noting that, at least for now, we’re seeing the contract/spot spread shrink to $.37, its smallest gap in 23 months. And this is not a result of falling contract rates, as those have held steady in January (+$.01).
We Need to Keep an Eye on Carrier Exits
While the capacity issues we’re seeing right now have been compounded by weather, there are still underlying long-term trends that we can’t ignore.
Capacity is leaving the market, and the pace is steadily increasing. Consider these metrics:
This reduction in excess supply puts additional stress on the sourcing of capacity, setting up the market’s reaction to a demand-incurred event. There is still a lot of capacity against current levels of demand, and election years have not often been kind to freight markets (reference 2016, 2012 and 2008). But anyone who thinks we’re not on a path to significantly capacity removal might want to stick their head out the window and check the temperature.
Taking a Deeper Dive Into Inventory Trends
Next week, we’ll do an in-depth analysis of Inventory-to-Sales Ratios, as we believe that inventory restocking is key to a demand recovery. Those numbers will be updated later this week. But in the meantime, we’ll note that there is a lot of discussion regarding the impacts of trade disruption — with open acts of aggression on the Red Sea, the continued issue of drought at the Panama Canal, and labor struggles at domestic US ports. All of this can wobble and weaken inventory levels quickly, bringing lean inventories all the way to stockouts. We continue to believe these events might trigger restocking, and we’re carefully watching all these events, both internationally and domestically.
A Close Look at Regional Dynamics
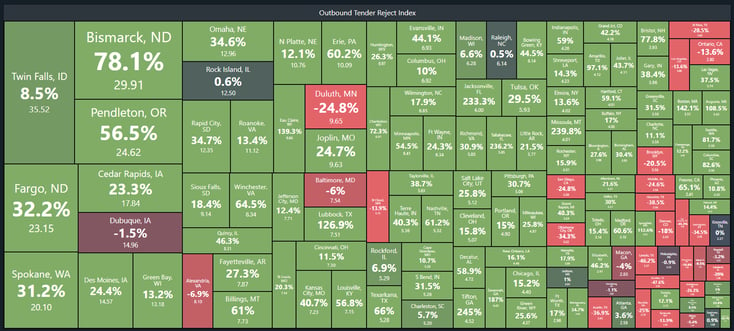
In market specifics, we’ve seen load-to-truck ratios remain tight in the Great Plains, with Kansas City, MO (4.44) and Cedar Rapids, IA (5.4) challenged for capacity. This has extended into the Mid-South, with Memphis extremely tight (4.0) and carriers emailing us early and often that they were closing down shop early for the day. In the Midwest, freight volumes are not high, but capacity has been staying home and waiting for brokers to match their rates. The oversupplied Chicago market (1.4) saw the most loads posted (2700) since 11/29/23 (the week after Thanksgiving). Green Bay, WI (3.76) has remained tight, as has Minneapolis, MN (3.84). On the East Coast, markets have not tightened quite as much, even though New York City saw its first snow in over 700 days. Regional capacity numbers look like this: Elizabeth, NJ (3.24), Philadelphia, PA (3.14), Harrisburg, PA (3.38) and Baltimore, MD (3.02). We expect at least a small bump in volume over the next two weeks as seasonally expected, given the import push on the East Coast that usually precedes the Lunar New Year, even with the current ongoing issues. We don’t anticipate this push being nearly as strong as years past, however. And we also don’t anticipate Southern California markets to tighten aggressively, even with freight being diverted its way, given that SoCal is typically seasonally slow until April (though with a small end-of-month push for February). One thing to watch through all this weather is the buildup of rail freight, as lack of rail service has the potential to create instant truckload demand that moves independent of seasonality..
Top 3 Charts for the Week
A Regional Look at Tender Rejection
Below is the week-over-week (WoW) look at tender rejections, with green indicating an increase in rejections, the percentage indicating the specific WoW increase in rejections, and the final number on the bottom of each box indicating the overall % of tender rejections from that outbound market. Cedar Rapids, IA, for example saw a 23.3% increase in tender rejections WoW, with an overall tender rejection rate of 17.84%.
National Trends in Tender Rejections
The current OTRI is 4.77% and has been climbing since January 10, well before weather became a factor.
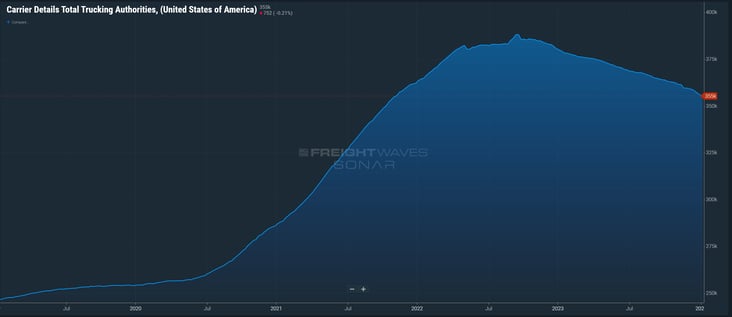
Carriers Continue to Exit
The exit of carrier authorities continues to accelerate. This is certain to have implications down the road.
Get Up to Speed with Weekly Market Intel
Follow the Redwood LinkedIn page and gain critical insights by watching Christopher Thornycroft’s Redwood Rundown video every Tuesday. And check out our insights blog to access the weekly Redwood Report and other news updates!