REDWOOD LOGIN
Redwood PortalLTL
SCS
SCS Support
Rockfarm

This Week’s Big Story: Is Spring Bringing New Signs of Life?
We’re in the first week of Q2 and seeing the wave of end-of-Q1 volume hit following the Easter weekend. It appears shippers did have freight to move, but they had to miss their Q1 sales deadlines to accommodate the holiday. This overflow was in question leading up to the holiday weekend, as everyone knew there would be a slowdown — but we were unsure of the demand expectations.
This is a small sign of life in the freight market. While it’s not a sign of significant imminent market changes, had the freight market simply continued without a volume bump we’d be saying that lack of movement revealed overwhelming weakness. Instead, we’re yelling across the floor to pick up the phones and call for trucks, and watching markets like Chicago and Indianapolis show stubbornness to move, even when these markets are still known to be oversupplied. We continue to believe that capacity leaving the market will stair-step rates up as seasonal changes in demand take place. The easy-to-identify pivot points in mid-May will be CVSA’s International Roadcheck and the kickoff of produce season, leading into the Memorial Day holiday later in the month.
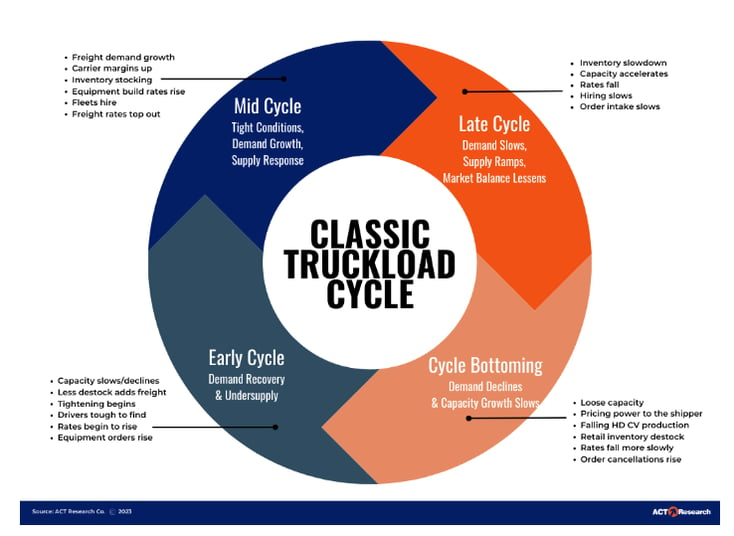
As we write this, we’re receiving updates from ACT Research that for one month, at least, we’ll see a significant decline in Class 8 net orders (preliminary), with Class 8 orders falling -10,400 units, or -38% month-over-month (MoM) and -8.7% year-over-year (YoY). If these preliminary totals hold, this is a sign that the market cycle is ready to start turning (see image from ACT Research below). This turn has not happened yet, as the expected seasonal increase in demand has not hit yet. End-of-Q1 overflow notwithstanding, we still anticipate a soft April with ample capacity and rates to trend slightly downward before coming back up. Even the stabilization of rates — which, again, is not expected — would showcase out-of-season market strength, and foreshadow a quicker turn than currently anticipated.
Keep reading to see our current updates on Economic Indicators, Demand, Capacity and Markets. We debuted this new format with our last Redwood Report, and we hope you like it. Please feel free to reach out with any additional topics you’d like to see covered.
Watch This Week's Redwood Rundown
Did you know you can also watch the weekly Redwood Rundown, where EVP of Procurement Christopher Thornycroft provides his expert insights in a video format? It’s the perfect way to take a quick look at the events and trends affecting your business this week. Take a look!
This Week’s Economic Indicators
The PMI (Purchasing Managers Index) was released for the month of March, increasing to 50.3%. This marks the first expansion in the manufacturing sector after 16 months of contraction. Increased manufacturing tends to impact less-than-truckload (LTL) markets first, and the overall freight market second. New Orders (which indicate future demand) were back in expansion territory at 51.4%. Customer Inventory levels are in contraction territory — which usually predicates increased New Orders — falling -1.8% to 44%.
Demand Trends for this Week
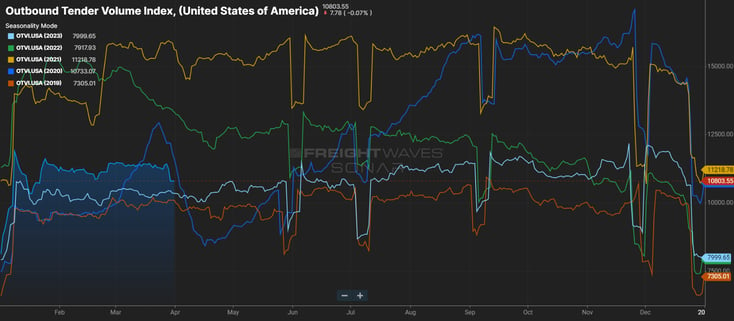
The Outbound Tender Volume Index (OTVI) dropped as it does seasonally with the Easter holiday. However, extending the trend we’ve seen all year, this drop still equates to a little more than a 7% increase over the post-Easter drop seen after the holiday last year on April 9.
The Inbound Ocean TEU’s Volume Index (IOTI) has moved all the way up to 1556. Any move past 1600 indicates that we’ll see a strong import-driven increase in freight volumes in roughly the next 30 days.
The Outbound Tender Rejection Index (OTRI) has trended up to 3.78%. However, it’s unknown if this upward trend simply reflects rejection ahead of the Easter holiday or something more. We will know more next week, once the seven-day rolling average moves past the Easter holiday.
The DAT Contract to Spot spread expanded +$.04 to +$.47 in March — the largest Contract to Spot spread since August 2023. However, contract rates only fell -$.01, and the highly volatile spot rate per mile (RPM) dropped -$.05. We anticipate a natural tightening of the Contract to Spot spread to occur in Q2, based on rising spot rates. When this spread tightens, it emboldens carriers to abandon contract rates which may be too lean for current operating costs. (Consider that the 2022 ATRI operating cost was $2.25 per mile. With increased insurance rates, operating costs have likely risen to $2.30+ per mile in 2024). If more profitable spot freight becomes easier to find, carriers will capture those opportunities.
Capacity Trends for this Week
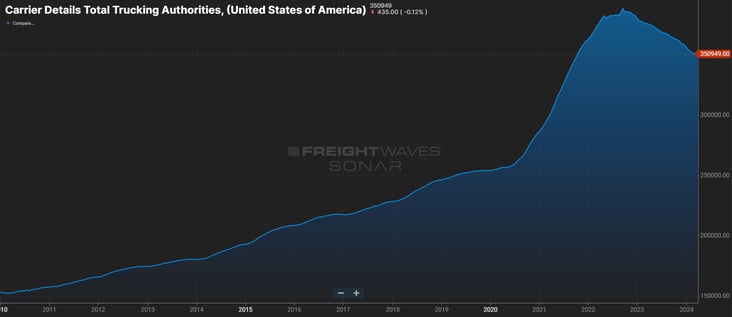
The number of Total Trucking Authorities finally dropped to begin April —down -435 to 350,949 — after a month of defying logic and staying flat. The vast majority of carrier authorities are small fleets who are highly dependent on the strength of the spot market. We are in the 13th straight month of negative year-over-year declines in the number of authorities, something we haven’t been able to say since the data first became available in 2010. February’s Long Distance Truckload employment numbers will be updated later this week. This is a much-preferred gauge of capacity trends, although on a two-month delay.
Regional Market Trends for this Week
With April here, look for volumes to begin to pick up in south Florida, particularly toward the end of the week when capacity has more market power. Temperature-controlled freight will be the tightest out of Florida this month, with the larger impact to dry van transportation coming later in the month —and peaking in Mid-May.
The border markets in Texas and Mexico generally heat up in April, as Central American produce imports move north — pushing rates up with it.
Southern California’s produce markets tend to pick up toward the end of April as well, starting with the Imperial Valley before moving north through Los Angeles. Look for Southern California to be moderately strong this week and next, based on imports, before a mid-month decline. Then regional volumes should pick up steam heading into the month of May.
The Pacific Northwest remains a backhaul market as brokers largely accept any available contract freight, and carriers have limited options on spot boards.
In the Midwest, the region is in the midst of its decline, and it won’t see the bottom on rates until summer. Looks for prices to continue to fall in April, particularly moving south toward the previously mentioned produce markets.
The Northeast is also in its seasonal market decline, and the Port of Baltimore temporarily closing will make matters worse in the month of April. Some of this volume will be pushed to other Northeast port markets, particularly the Port of Norfolk, which has seen inbound twenty-foot equivalent units (TEUs) rapidly rise in the last few days.
An Update on the Port of Baltimore
The Port of Baltimore is working furiously to clear the way for inbound ships, as $180 million of daily revenue is lost with the port closed. However, at this time no containerships have been allowed in.
As previously mentioned, we’re seeing the largest increase in shipments and TEUs headed to the Port of Norfolk as decisions begin to get made about where freight will be diverted. The Port of Norfolk saw its trailing seven-day average of TEUs increase by 25.4% on Monday. Meanwhile, gains have been modest for the Port of NYC and Port of Philadelphia. The Port of Miami has also seen a large jump (+33% TEU increase since March 28), but it’s unknown whether this is related to freight being diverted to this market.
Top 3 Charts for the Week
Understanding the Truckload Demand Cycle
This graphic from ACT Research provides a graphic illustration of the cyclical demand cycle for truckload freight.
The OTVI Is Down, as Expected
As expected, the Outbound Tender Volume Index (OTVI) dropped following the Easter holiday. However, the drop was not as large as we observed following Easter 2023.
Capacity Continues to Exit
The US freight industry is in its 13th straight month of year-over-year declines in the total number of trucking authorities.
Get Up to Speed with Weekly Market Intel
Follow the Redwood LinkedIn page and gain critical insights by watching Christopher Thornycroft’s Redwood Rundown. And check out our insights blog to access the weekly Redwood Report and other news updates!